Downloadable resource
- PDF Version
- Visual Representation
- Understanding the bell curve
- Common statistical methods and equations
Psychological research can seem intimidating when it is first encountered. Terms such as variables, validity, correlation, regression, statistical significance, and effect size can make research appear to be a collection of formulas and specialized procedures. At its core, however, research is much more straightforward: it is a systematic way of asking questions and determining what evidence is needed to answer them responsibly. Understanding Psychological Research Methods for Curious Minds was developed to make that process accessible without oversimplifying the science behind it.
This guide follows research as a connected process rather than treating research design and statistics as separate topics. Readers begin with research questions and move through operational definitions, sampling, measurement, quantitative and qualitative approaches, experimental and nonexperimental designs, data analysis, and interpretation. Throughout the guide, particular attention is given to the connection between the question being asked, the evidence collected, the method of analysis, and the conclusion that can reasonably be drawn. Visual examples and practical applications are included to make concepts easier to recognize and apply rather than simply memorize.
Statistics are presented within this larger research process. Descriptive statistics, correlation, regression, t tests, ANOVA, p values, effect sizes, confidence intervals, and related concepts are introduced not simply as calculations, but as tools researchers use to make sense of evidence. Just as importantly, the guide examines the limits of individual studies, including alternative explanations, uncertainty, sampling limitations, replication, and the role of meta-analysis in building a broader body of scientific knowledge. The goal is not to turn every reader into a statistician. It is to develop enough methodological understanding to ask better questions, evaluate evidence more carefully, and recognize the difference between what research suggests and what it actually demonstrates.
Learning Outcomes
By the end of this guide, readers should be able to:
- Develop and evaluate research questions by identifying constructs, variables, operational definitions, populations, and the types of evidence needed to address a question.
- Differentiate major research approaches and designs, including quantitative, qualitative, correlational, experimental, and mixed-methods research, and explain how design choices affect the conclusions that can be supported.
- Evaluate the quality of psychological measurement and evidence using concepts such as reliability, validity, sampling, comparison groups, confounding variables, and ethical research practices.
- Interpret commonly used descriptive and inferential statistical evidence, including distributions, correlation, regression, t tests, ANOVA, p values, effect sizes, and confidence intervals.
- Distinguish association, prediction, and causation and recognize alternative explanations, moderation, mediation, uncertainty, and other limits on research conclusions.
- Evaluate psychological findings within a broader body of evidence by considering replication, consistency across studies, meta-analysis, study limitations, and the boundaries of defensible scientific claims.
Introduction to Research Methods in Psychology
Psychological research begins with a question about behavior or mental processes. Answering it requires more than collecting observations: researchers must decide what they mean by their key concepts, choose a design that fits the question, and judge what their results can support. This chapter follows that process from the first question to the final claim. It uses one recurring example (whether study time is related to exam performance) to show how different methods answer different versions of the same question.
By the end of the chapter, readers should be able to turn a broad question into a measurable one; distinguish descriptive, correlational, experimental, qualitative, and mixed methods; identify variables and threats to a study’s conclusions; interpret basic statistical results; and evaluate whether a finding might apply beyond the people studied.
From a question to a study
Imagine noticing that students who spend more time preparing for an exam often earn higher scores. That observation raises several questions. How much time do students actually study? Is study time associated with exam scores? Would asking students to study longer improve their scores? How do students decide when and where to study? Each question calls for a different kind of evidence.
Researchers usually begin by reading relevant scholarship. Previous studies can clarify what is already known, reveal competing explanations, and help researchers choose a useful measure. They then state a focused research question and, when appropriate, a hypothesis: a specific expectation that evidence can support or challenge. A hypothesis about study time might be, “Students who spend more hours studying during the week before an exam will earn higher exam scores.” This statement identifies two measurable variables and predicts a direction of association.
Research is iterative. A study’s results may answer the original question only partly, challenge an assumption, or point to another question. Researchers communicate their methods and findings so other people can assess the work, repeat it, or extend it. In applied settings, the audience may be a school, clinic, or organization deciding what to do. In all settings, the claim should match the evidence that was collected.

Choosing the kind of evidence
Quantitative research represents observations with numbers. It can estimate how common a behavior is, compare groups, or examine relationships among measured variables. A researcher could survey students about their study hours and collect their exam scores. Numbers make it possible to summarize patterns and estimate uncertainty, but they do not explain every reason for those patterns.
Qualitative research examines meaning, experience, and context through materials such as interviews, observations, and documents. Interviews might reveal that two students who each report six hours of study used that time differently: one practiced retrieving information while the other reread notes. Qualitative work is systematic. Researchers describe how they selected participants, collected material, analyzed it, and considered interpretations that did not fit their first impression. Qualitative findings are not simply anecdotes, and numerical findings are not automatically free of judgment; both approaches depend on careful choices about what to observe.
Mixed methods deliberately combine quantitative and qualitative evidence to answer related parts of a question. Consider an organization with high turnover. A survey might locate the teams with the highest reported burnout; interviews could then explore how employees understand their work conditions. The study is strongest when the two strands are connected—for example, when survey findings guide interview questions and interview findings help interpret the survey pattern. Merely adding interviews to a survey does not, by itself, provide a fuller explanation.
The choice of method follows the question. “How many?” often calls for quantitative measurement. “How do people experience this?” often calls for qualitative inquiry. “Does changing this condition change an outcome?” calls for a design capable of evaluating a causal claim. A project may need more than one approach.
Qualitative methods also have distinct analytic traditions. A case study examines one person, organization, event, or setting in depth using evidence suited to the question. Interview and observational studies can compare how people describe and act in a situation. Grounded theory uses systematic comparison of data to develop an explanatory account; it is not simply a test of a theory chosen in advance. These approaches require researchers to explain how they moved from source material to their interpretation. Readers should be able to see what evidence supports the account and where another interpretation remains possible.
Published research example: interviews. Severe and colleagues (2024) interviewed 19 university students about why they did or did not speak in class. Rather than assigning a participation score and comparing averages, the team repeatedly read the interviews, coded passages, and developed themes about instructors, peers, course material, and students’ decisions to speak. They reported how students were selected and how disagreements in coding were resolved. The study illustrates how interviews can uncover reasons behind a behavior that a count of raised hands would miss. Its participants came from one university and a narrow set of courses, so the themes are starting points for understanding other classrooms, not estimates of how often every student has these experiences.
Published research example: grounded theory. Soubra and colleagues (2023) interviewed 20 UK health and social care workers about coping while working on the front line of the COVID-19 pandemic. They analyzed interviews while data collection continued, comparing accounts and refining categories to build an explanatory model of coping. This iterative movement between gathering and analyzing evidence is central to grounded theory. The resulting model proposes relationships among experiences; it is an interpretation of these participants’ accounts, not a numerical estimate of how often each experience occurs among all workers.
Published research example: mixed methods. Morris and colleagues (2021) studied college experiences during the shift to remote education. They combined surveys and repeated brief reports from students in 2019 and 2020 with interviews of 27 students in 2020. Average levels of several distress measures did not change markedly between the cohorts, yet the quantitative analyses found substantial differences in individual trajectories. Interviews described circumstances behind those varied experiences, including isolation from peers and difficulty adapting to family needs. This is a useful example of integration: the interviews helped explain why an average could conceal quite different student experiences. The year comparison was observational, so it cannot isolate the pandemic from every other change between 2019 and 2020.
Published research example: a case. Scoville and Milner (1957) documented severe memory difficulties after medial temporal lobe surgery in a series of patients, including the patient later known as H.M. Detailed observation of an unusual case raised questions about the brain systems needed for new memories. The operations were clinical treatments, not procedures assigned for research, and the affected tissue was not limited to a single structure. A case can reveal an important pattern without, by itself, isolating one mechanism or showing how common the pattern is.

Figure 1: Method decision map
Section 1: Designing a quantitative study

Figure 2: From construct to operation
Define and measure the variables
A variable is a characteristic that can take different values. Study time might be recorded as hours per week, and exam performance as a percentage score. The way a researcher turns an idea into a specific observation is its operational definition. “Study time” needs one: Does it include attending class, completing homework, reviewing notes, or taking practice tests? Without a clear definition, two studies may appear to examine the same question while measuring different activities.
Good measures need reliability and validity. Reliability concerns consistency: would the procedure give reasonably similar results when the underlying characteristic has not changed? Validity concerns whether the evidence supports the intended interpretation. A student’s estimate of study hours may be easy to collect but inaccurate; an app’s record of time spent with course material may be more precise while missing study done on paper. Neither measure is automatically the “true” amount of studying. Researchers should explain what a measure captures and what it misses.
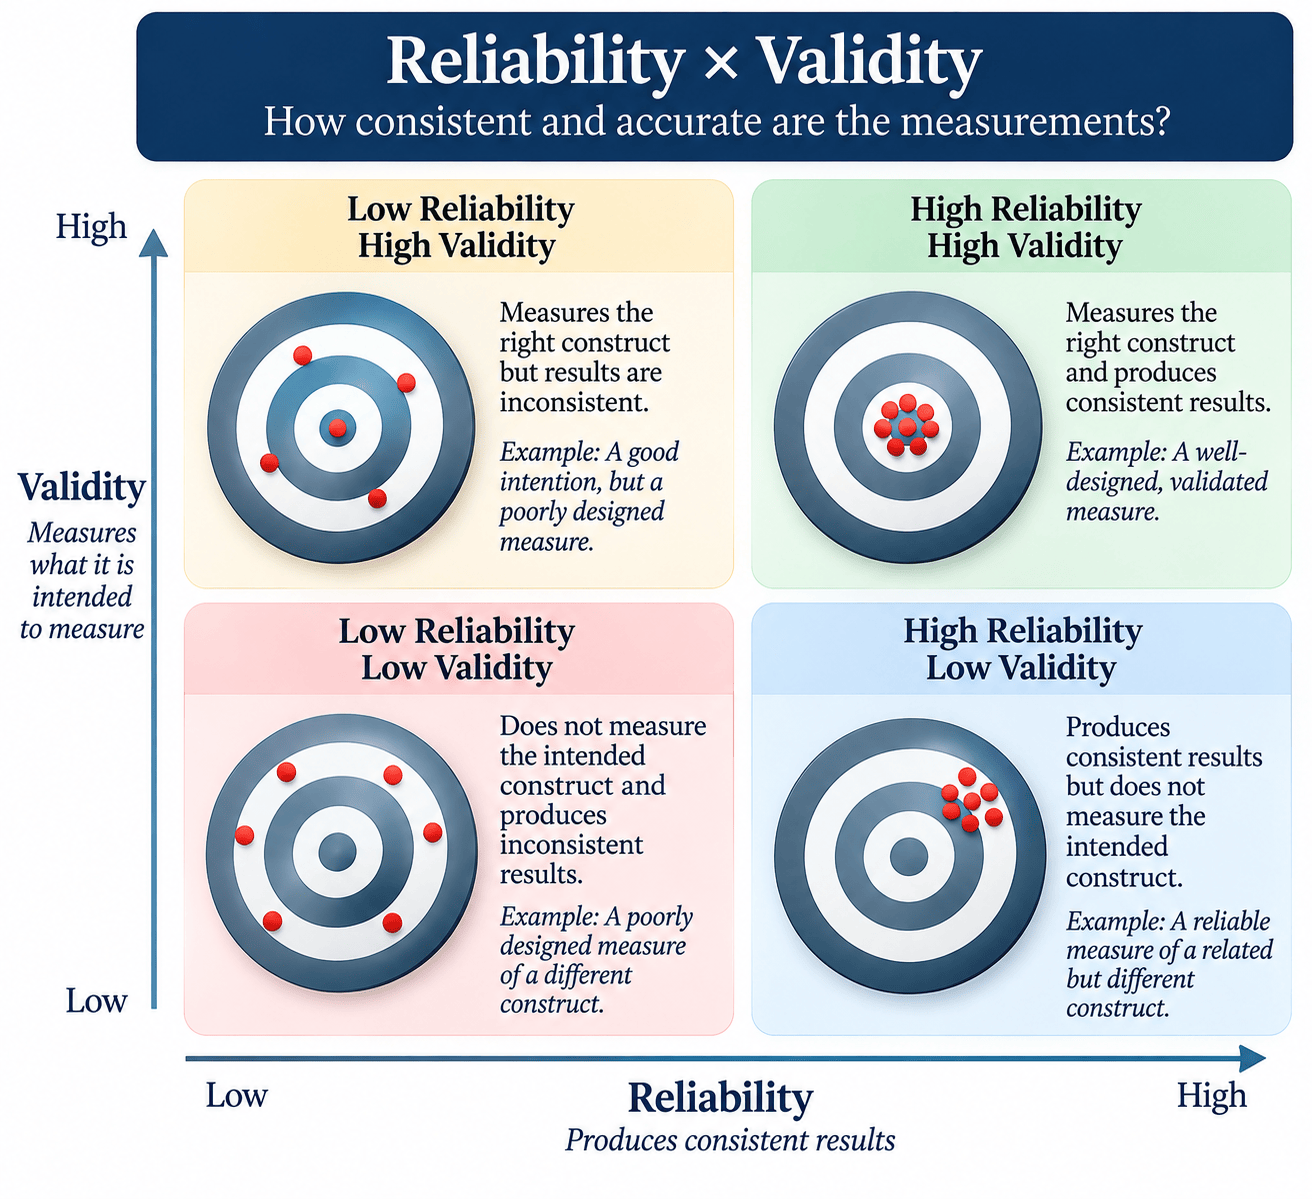
Figure 3: Reliability x Validity
Measurement decisions can create apparently contradictory findings. One study might define studying as any time spent with a textbook, while another counts only active practice. A student could score high on the first measure and low on the second. Before comparing results, a reader should ask whether the studies measured the same activity. A questionnaire developed in one language, culture, or age group may also need further evaluation before its scores are interpreted elsewhere.
Published research example: building a scale. Duckworth and colleagues (2007) began with 27 proposed questions about sustained effort and interests. In a large adult sample, they examined item correlations and reliability, then used exploratory factor analysis on one half of the data to look for clusters of responses. Two clusters—perseverance of effort and consistency of interests—were retained in a 12-item scale. They used the other half of the sample for confirmatory factor analysis. Factor analysis is a tool for studying the structure of a measure; it does not establish that a personality trait has one inevitable definition. The researchers also examined how scores related to education and other outcomes, which supplied a different kind of validity evidence.
Measurement also affects analysis. Nominal values name categories without an inherent order, such as course section. Ordinal values have an order but may not have equal distances between levels, such as a single response from “strongly disagree” to “strongly agree.” Interval or ratio values express numerical differences on a defined scale; hours studied are a ratio measure because zero hours means no time studied. Researchers sometimes analyze a multi-item rating scale approximately as continuous, but they should justify that choice rather than assume that every ordered response is an exact measurement.
Identify the population and sample
The population is the group a researcher wants to understand. A sample is the subset actually studied. If the question concerns all first-year college students, recruiting volunteers from one psychology course provides only a narrow sample of that population. A large sample can improve precision, yet size alone does not fix a poor match between the sample and the population. The method of recruitment, participation rate, and characteristics of people who do not participate matter too.
Sampling and assignment answer different questions. Random sampling can help make a sample representative of a defined population when it is feasible. Random assignment places recruited participants into study conditions by chance and helps make the groups comparable before an intervention. A study can have random assignment without a representative sample. It may then support a causal conclusion for the study setting more strongly than a claim that the result applies to every student.
Published research example: a narrow sample. Eisenberger, Lieberman, and Williams (2003) scanned 13 college students’ brains while they played a virtual ball-tossing game that included social exclusion. They compared brain activity during inclusion and exclusion and related activity to self-reported distress. The study shows how an abstract idea such as social exclusion can be given a specific laboratory procedure and paired with multiple measures. It also shows why readers should inspect the sample and task before extending a finding to all forms of rejection or claiming that one brain region alone controls a complex emotion.
Section 3: Plan for alternative explanations and ethics
A confound is a factor that provides a competing explanation for an apparent effect because it varies with the condition being studied. Suppose students choose whether to join a nine-hour study group or a three-hour group. The nine-hour group may differ in prior knowledge, motivation, available time, or access to a quiet place. A later score difference cannot confidently be credited to study time alone. Researchers can reduce such problems through random assignment, comparable procedures, careful measurement, and analysis, although no design removes every source of uncertainty.
Not every outside influence is a confound. An exam room’s temperature might add variation to scores without favoring either study condition. If one condition always takes the exam in a cool room and the other in a hot room, however, temperature becomes a plausible competing explanation. Recording how a study was carried out helps readers assess that distinction.
Research involving people also requires ethical planning. Participants need appropriate information about what participation entails, protection of their privacy, and freedom from avoidable harm. A question can be scientifically interesting and still require a different design if the proposed manipulation would be unfair or harmful. For example, researchers cannot deliberately place children into seriously harmful environments to test developmental outcomes. They can instead study naturally occurring differences while acknowledging the limits of causal interpretation.
Section 4: Describing data and examining relationships
Before testing a hypothesis, researchers should inspect the data. A table or graph can reveal missing values, unusual scores, and patterns that one summary number would hide. A mean is the arithmetic average. A median is the middle score when observations are ordered, and a mode is the most frequent value. The mean can be pulled by unusually high or low values, so the median may better describe the center of a skewed distribution.
Standard deviation describes spread around the mean. More precisely, it is the square root of the average squared deviation from the mean, with a slightly different divisor often used for a sample. It is not the average ordinary distance from the mean. If a distribution is approximately normal, about 68% of values fall within one standard deviation of the mean and about 95% within two. Researchers should check the shape of the observed data rather than assume every variable becomes bell-shaped when enough observations are collected. The familiar bell curve is a useful model, not a universal law of measurement.
Published research example: looking beyond the mean. In the Morris and colleagues (2021) student study, average distress scores alone suggested little overall change between 2019 and 2020. The researchers also examined variation across students and changes over time. Students who reported greater vulnerability at the beginning of a term followed worse trajectories than others. This is why descriptive work should include spread and distributions, and why a mean can be a poor summary of a group with very different experiences.
Correlation
A correlation summarizes the direction and strength of a linear relationship between two numerical variables. Its coefficient, commonly written r, ranges from −1 to +1. A positive value means higher values on one variable tend to accompany higher values on the other. A negative value means higher values on one tend to accompany lower values on the other. A value near zero indicates little linear relationship, although a curved relationship may still exist. A scatterplot should accompany a correlation whenever possible: unusual cases and nonlinear patterns can change how a single coefficient should be read.
If study time and exam score have a positive correlation, that does not establish that studying longer caused the higher score. Better-prepared students may study differently, and other conditions may influence both study time and performance. Reversing the direction of a proposed explanation can also matter: a student expecting to struggle may study more. The statement “correlation does not establish causation” is a reminder to examine these alternatives, not a reason to dismiss correlational findings. Correlations can describe valuable patterns and help generate testable causal questions.

Figure 4: Correlation Gallery
Regression
Regression estimates how an outcome varies with one or more predictors. In a simple linear regression, a line estimates expected exam score from study hours. The line has an intercept, its predicted score when study hours equal zero, and a slope, the predicted change in score for one additional hour of study. The intercept is a mathematical part of the model; it may have little practical meaning if the study included no students who studied zero hours.
The model’s R² describes the proportion of variation in exam scores accounted for by the predictors in the analyzed data. In a simple linear regression with one predictor and an intercept, R² equals the square of the Pearson correlation. Thus, if r = .20, R² = .04: the fitted line accounts for 4% of the observed variation in exam scores, not 20%. The remaining variation may reflect other factors, measurement error, and random variation. “Explained” here is a statistical description of the model’s fit; it is not proof that study time caused that share of anyone’s score. Predictions should also be checked against new data, because a line fitted to one sample can perform less well elsewhere.

Figure 5: Understanding regression
Published research example: correlation and prediction. In one of Duckworth and colleagues’ (2007) studies, grit scores and grade point averages among students at one selective university had a correlation of r = .25. Squaring that correlation gives about .06, so a simple straight-line model using grit alone would account for roughly 6% of the observed variation in grades. The researchers also examined the association while taking SAT scores into account. This is a useful distinction between a bivariate correlation, which describes two variables together, and multiple regression, which estimates a relationship while including other measured predictors. The study was observational and used a selective student sample. It did not show that increasing someone’s grit would raise their grades.
Correlation and regression may help ask more specific questions. A moderator changes the strength or direction of a relationship: study time might have a stronger association with exam scores when students use practice questions than when they only reread notes. A mediator is a proposed step in the process linking a predictor to an outcome: practice with retrieving information might help explain why an assigned study program improves later scores. These are different claims. A smaller regression coefficient after adding another variable does not, by itself, establish a mediating mechanism; the proposed sequence and other explanations need evidence too.

Figure 6: Moderator & Mediator
Published research examples: moderator and mediator. Wang and colleagues (2014) surveyed 632 undergraduates about stress, perceived social support, and depressive symptoms. In a regression model, the stress–symptom association was weaker at higher levels of support: an interaction between stress and support indicated moderation. The association did not vanish at high support, and a one-time survey cannot show that increasing support would prevent depression. Duckworth and colleagues (2007) asked a different question in a study of spelling-bee finalists. Their analyses were consistent with weekend practice partly accounting for the relation between grit scores and contest progress—a proposed mediation pathway. Because grit and practice were not assigned experimentally, that pathway remains an interpretation requiring further tests.

Figure 7: Correlation and causation
Section 5: Testing a causal question
To ask whether increasing study time improves scores, a researcher could create two comparable study conditions. Participants might be randomly assigned to a structured three-hour or nine-hour weekly study plan, receive the same learning material, and take the same exam. The independent variable is the assigned study condition; the dependent variable is the measured exam score. A comparison group provides a reference for interpreting the result. Researchers would also monitor whether participants followed the assigned plans, because an assignment is not the same as the time actually spent studying.
Random assignment reduces systematic differences between groups before the intervention. Holding other procedures as similar as possible helps isolate the intended difference. A score gap after the intervention would then provide evidence about the effect of the assigned study plan in that setting. It would still be necessary to consider the quality of the measures, departures from the plan, chance variation, and whether the result is likely to hold for other courses or students. Causal conclusions are strongest when the design rules out plausible competing explanations, not when a particular statistical test returns a small p-value.
Even in an experiment, the exact causal claim deserves care. Assigning a nine-hour plan tests the effect of being offered or directed to follow that plan, under the procedures used. If many participants in both groups study for roughly the same amount of time, the experiment may say little about the effect of actually studying six additional hours. Researchers should report adherence and be clear about whether they analyze participants according to assignment or actual behavior.
With two groups, a researcher might use a t test to estimate and evaluate a difference in mean scores. With three or more conditions, an analysis of variance, or ANOVA, can test whether the mean scores differ somewhere among the groups; follow-up comparisons may be needed to identify which groups differ. These methods are also used with observational data, where they compare groups without making the comparison causal. The design determines the strength of the causal inference; the test quantifies the pattern and its uncertainty.

Figure 8: Experimental design explained
Published research example: ANOVA and follow-up tests. Roediger and Karpicke (2006) examined whether studying prose passages again or practicing recall improved later memory. In their second experiment, 180 undergraduates entered one of three learning conditions: four study periods, three study periods plus one test, or one study period plus three tests. Half took a final recall test after five minutes; half returned after one week. A two-factor ANOVA examined learning condition, test delay, and their interaction. The interaction was substantial in this sample, F(2, 174) = 18.48, partial η² = .18: repeated study helped on the immediate test, while repeated testing helped after a week. At the one-week test, the repeated-testing group recalled 61% of idea units and the repeated-study group 40%. A follow-up t test for that comparison gave t(58) = 4.78 and a standardized difference of d = 1.26. The F and t statistics evaluate patterns under statistical models; partial η² and d describe their sizes in different ways. The example shows why the interaction and a specific comparison are more informative than an overall average across conditions.
Published research example: a field experiment. Cohen and colleagues (2006) randomly assigned seventh-grade students to a brief writing exercise about personally important values or to a comparison exercise. They examined course grades using regression and tested whether the intervention’s relationship with grades differed across student groups. In two cohorts at the same school, the intervention was associated with higher grades among the African American students in the study. Random assignment supports a causal conclusion about the assigned exercise in that setting. The study does not show that every school would obtain the same result or that the proposed psychological mechanism was conclusively established.
Some questions cannot be studied by manipulating the key factor. Researchers can then use longitudinal, natural-experiment, or other observational designs to strengthen an explanation, while being explicit about remaining alternative explanations. Qualitative interviews can add understanding of how participants experienced a condition, but an interview alone does not determine what would have happened to that same person under a different condition.
Section 6: Interpreting evidence without overstating it
Hypotheses and errors
In a common approach to statistical testing, the null hypothesis specifies a model with no effect or no association of the kind being tested. An alternative hypothesis specifies a competing pattern, such as a difference between study conditions. Researchers use the data to assess how compatible the observations are with the null model. They may reject the null hypothesis or fail to reject it. Failing to reject is not the same as demonstrating that the groups are identical.
Two mistakes are possible. A Type I error occurs when a test rejects a true null hypothesis. A Type II error occurs when it fails to reject a false null hypothesis. The chosen significance threshold, sample size, natural variation, measurement quality, and size of the true effect all influence these risks. A power analysis before data collection can help plan a sample capable of detecting an effect considered meaningful. There is no universal rule that 30 participants are enough for every quantitative study; the needed sample depends on the question and design.
P-values, effect sizes, and intervals
A p-value describes how unusual the observed test statistic, or one more extreme, would be under the specified statistical model if the null hypothesis held. A threshold such as .05 is a decision convention, not a boundary between truth and falsehood. A p-value below .05 does not mean there is less than a 5% chance the result is due to error. It also does not give the probability that the finding will replicate or apply to a different population. The American Statistical Association cautions against treating a single threshold as a complete scientific conclusion.
An effect size describes the magnitude of a pattern in a defined way, such as a difference between group means or the proportion of variation accounted for by a model. A very small effect can be statistically significant in a large sample; an important effect can be estimated imprecisely in a small one. Researchers should report the estimate and an appropriate confidence interval, which shows a range of values compatible with the data and the method’s assumptions. A confidence interval is not a promise that a particular future study’s result will fall inside it. Together, the effect estimate, interval, study design, and context are more informative than a significance label alone.
Imagine that the nine-hour plan raises mean exam scores by two points, with a confidence interval ranging from almost no improvement to four points. That estimate may be useful for some decisions and too small for others. A school considering a costly mandatory program would weigh the likely benefit against students’ time and other demands. A student choosing a low-cost change to their own routine might make a different judgment. Statistical results describe evidence; practical importance also depends on the decision and its costs.
When reading a finding, ask four questions: What was measured? How large was the estimated pattern? How uncertain was the estimate? What other explanations remain plausible? A conclusion such as “the structured nine-hour plan raised mean exam scores in this sample” is more useful than the isolated statement “the result was significant.” It tells the reader what changed and where the evidence came from.
From one study to broader knowledge
Internal validity concerns whether the study supports its conclusion about what produced the observed outcome. External validity concerns how well the result might apply to other people, settings, tasks, and times. These are related but separate questions. Randomly assigning volunteers from one course to study plans may improve internal validity, while still leaving uncertainty about students in different courses, schools, or life circumstances.
Replication is another part of evaluation. Researchers may repeat a study’s procedures with a new sample, or test the same idea with different measures and settings. A result that changes across studies calls for investigation: sample differences, procedures, chance variation, and the original claim’s scope may all matter. A single failed replication does not automatically erase every earlier result, just as a single significant result does not establish a universal effect. Reviews that compare multiple studies can help describe the overall evidence, provided the studies are sufficiently comparable and their quality is assessed.

Figure 9: Statistical evidence dashboard
Published research example: a replication project. The Open Science Collaboration (2015) coordinated replications of 100 experimental and correlational studies drawn from three psychology journals. Ninety-seven percent of the original studies reported a statistically significant result for the selected effect, while 36% of the replications did. That comparison is informative, but “36% of all psychology replicates” would be an incorrect conclusion: the project studied a particular set of papers, and replication can be judged by several criteria. The project also compared effect estimates, finding that replication effects were smaller on average. Students can use this example to ask why both the size and precision of a result matter beyond its p-value.
Published research example: synthesis across studies. Hyde (2005) reviewed 46 meta-analyses of psychological gender differences. By examining standardized effect sizes from many topics, she showed that most reported differences were small or near zero, while some were larger. This is a better basis for discussing the magnitude of a difference than pointing to one statistically significant comparison. It is also a reminder that “some difference was detected” and “two groups scarcely overlap” are very different claims. A synthesis is only as strong as the studies, measures, and populations it brings together.
Time matters as well. A finding about learning habits from decades ago may still be useful, but changes in technology, schooling, and daily life could affect whether it applies today. The right question is not simply whether a study is old. It is whether its participants, measures, context, and results provide evidence for the present claim.
Psychological research is strongest when its questions, measures, design, analysis, and interpretation fit together. A careful reader can follow that chain backward from any headline: What exactly is being claimed? What was observed? Who was studied? How were the variables measured? Which alternative explanations did the design address? What remains uncertain? Those questions make research findings more useful in everyday decisions without asking any single study to say more than it can.
Section 7: Putting the sequence together
Suppose a researcher asks whether a structured study plan improves exam performance. First, the researcher reviews previous work and defines what counts as studying and how performance will be measured. Next, the researcher recruits students, records who they are and how they were recruited, and randomly assigns them to a study plan. After both groups receive the same course material and exam, the researcher reports each group’s scores, the estimated difference, an interval showing uncertainty, and any problems with following the plans. The discussion describes the effect of assignment in this sample and considers whether the result could extend to other students or classes.
Another researcher might begin with interviews about how students prepare when they have jobs or family obligations. That study could identify obstacles a fixed-hours experiment overlooked and suggest a more realistic intervention. A later experiment could test the revised plan. The studies do different work, but each contributes to a clearer answer. A finding can sharpen the next question without being the final word.

Figure 10: Scientific process
Section 8: Research ethics
A well-designed study asks a clear question and uses methods that can answer it. It must also protect the people who make the research possible. A study of stress, for example, may produce useful knowledge while asking participants to disclose sensitive experiences. Researchers must consider those risks when choosing questions, recruiting participants, collecting data, and reporting results.
What does an IRB do?
An Institutional Review Board (IRB) is a group that independently reviews plans for research involving human participants when review is required. Its purpose is to protect participants’ rights and welfare. Under U.S. federal human-subjects regulations, IRB reviewers consider whether risks have been minimized and are reasonable in relation to the expected benefits and knowledge; whether participants are selected fairly; whether informed consent will be handled appropriately; and whether privacy and confidentiality protections are adequate. The IRB may approve a study, require changes, or disapprove it. U.S. Department of Health and Human Services, Office for Human Research Protections (OHRP)
The process generally begins before recruitment or data collection. The researcher describes the question, participants, recruitment plan, procedures, risks, benefits, consent process, and data protections in a study protocol. The institution then determines whether the activity is human-subjects research and what review, if any, applies. Some research qualifies for an exemption; some eligible research may receive expedited review; other research goes to a convened IRB. “Expedited” describes a permitted review procedure, not permission to begin immediately. Researchers follow their institution’s determination and any approved protocol, submit required changes for review, and report problems as required by institutional policy. OHRP guidance on determining human-subjects research and IRB review
A classroom design exercise is different from conducting a study. The worksheets in this chapter ask students to plan research; students can complete them without recruiting anyone or collecting personal information. If a class project moves from a hypothetical plan to collecting data from people, the instructor should consult the institution’s human-research office before collection begins. Students should not assume that a survey is exempt simply because it is brief or anonymous. Institutional procedures identify who makes that determination. OHRP guidance on exemption determinations
Applying the APA Ethics Code
The American Psychological Association’s Ethical Principles of Psychologists and Code of Conduct provides another framework for research decisions. Its broad principles call for promoting welfare, acting responsibly, maintaining integrity, treating people fairly, and respecting their rights and dignity. Those principles are aspirational; the Code’s specific ethical standards state professional requirements. The standards address research approval, informed consent, recording, participants who have dependent relationships with researchers, inducements, deception, debriefing, and honest reporting. APA Ethics Code
Several responsibilities are especially relevant to the studies in this chapter:
- Obtain required approval and follow the approved plan. APA Standard 8.01 directs psychologists to provide accurate information when institutional approval is required, obtain that approval before conducting research, and work within the approved protocol. APA Ethics Code, Standard 8.01
- Make participation an informed choice. Consent is a process of explanation and opportunity for questions, not merely a signature. Participants should understand what they will do, foreseeable risks and benefits, the limits of confidentiality, any incentives, whom to contact, and their ability to decline or withdraw. For an experimental intervention, they also need to understand how assignment works and what the comparison group will receive. APA Ethics Code, Standard 8.02
- Protect privacy and recognize power differences. An interview about mental health may require careful handling of recordings and identifying details. APA generally requires informed consent before recording voices or images for research, subject to the Code’s stated exceptions. Researchers who recruit their own students, clients, patients, or subordinates must protect them from adverse consequences if they decline or withdraw. If research participation is required for a course or offered for extra credit, students must have an equitable alternative activity. APA Ethics Code, Standards 4.01, 8.03, and 8.04
- Use deception only under strict conditions. A researcher might want to conceal a study’s precise purpose so participants do not change their behavior. The APA Ethics Code permits deception only when its prospective value justifies it and effective nondeceptive alternatives are not feasible. It prohibits deception about research reasonably expected to cause physical pain or severe emotional distress. Researchers must explain integral deception as early as feasible and permit participants to withdraw their data. Debriefing also gives participants an opportunity to learn about the study and correct misunderstandings. APA Ethics Code, Standards 8.07 and 8.08
- Report the evidence honestly. Ethical obligations continue after data collection. Researchers must not fabricate data, present another person’s work as their own, or claim more certainty than their results support. They should correct significant errors they discover in published data. In this chapter’s terms, an ethical report distinguishes association from causation and discusses limitations alongside findings. APA Ethics Code, Standards 8.10 and 8.11
Consider a student’s proposed study of whether social support reduces stress among classmates. Before collecting data, the student would need to ask: Could classmates feel pressured to participate? Would answers reveal sensitive information? Who would see the responses? How would students decline without penalty? Would the proposed design require institutional review? These questions may lead the student to revise recruitment, use a less intrusive measure, strengthen data protections, or keep the project as a research plan rather than a data-collection exercise. Ethical review is part of designing a study capable of producing trustworthy knowledge while respecting the people involved.
Section 9: Research summaries
The studies below provide a quick reference for how a research question leads to a design, an analysis, and a claim. The final note for each study identifies a boundary students should keep in mind when using its findings.
Table 1 Research summary
| Study | Question, approach, finding, and limit |
| Severe et al. (2024) Class participation | Question: Why do students choose to speak or remain silent in class? Design and sample: Qualitative interviews with 19 university students. Analysis and finding: Inductive thematic coding identified influences involving instructors, peers, course material, and students’ decisions. Interpretive limit: One university and a narrow course setting; themes are not population frequencies. |
| Soubra et al. (2023) Coping at work | Question: How did frontline workers cope during the COVID-19 pandemic? Design and sample: Grounded theory study using interviews with 20 UK health and social care workers. Analysis and finding: Iterative coding and comparison during data collection produced an explanatory model of coping. Interpretive limit: The model interprets participants’ accounts; it does not estimate prevalence across workers. |
| Morris et al. (2021) College from home | Question: How did students’ experiences differ during remote education? Design and sample: Mixed methods using 2019 and 2020 student survey cohorts, repeated reports, and 27 interviews. Analysis and finding: Group averages hid varied distress trajectories; interviews supplied context for those differences. Interpretive limit: The observational year comparison cannot isolate the pandemic from other changes. |
| Scoville and Milner (1957) Memory after surgery | Question: What memory difficulties followed medial temporal lobe surgery? Design and sample: Clinical case series including the patient later known as H.M. Analysis and finding: Detailed memory observations linked surgery to severe difficulty forming new memories. Interpretive limit: The surgery affected more than one structure; cases alone cannot isolate one mechanism. |
| Duckworth et al. (2007) Grit scale | Question: Can sustained effort and interests be measured, and how do scores relate to outcomes? Design and sample: Scale development and several observational samples, including university students and spelling-bee finalists. Analysis and finding: Factor analysis supported two components; one student sample had grit-GPA r = .25. Practice was examined as a possible mediator of contest progress. Interpretive limit: Associations and mediation models do not show that changing grit causes better outcomes. |
| Eisenberger et al. (2003) Social exclusion | Question: How is a laboratory experience of social exclusion related to distress and brain activity? Design and sample: fMRI study of 13 college students playing a virtual ball-tossing game. Analysis and finding: Activity during exclusion was compared with inclusion and related to reported distress. Interpretive limit: A small student sample and one task do not represent every experience of rejection. |
| Wang et al. (2014) Stress and support | Question: Does perceived social support change the stress-depression association? Design and sample: Cross-sectional survey of 632 undergraduates. Analysis and finding: A regression interaction showed a weaker positive stress-symptom association at higher support. Interpretive limit: The one-time survey does not show that increasing support would prevent depression. |
| Roediger and Karpicke (2006) Testing and recall | Question: Does practicing recall improve later memory more than restudying? Design and sample: Experiment 2 assigned 180 students to three learning conditions and two test delays. Analysis and finding: ANOVA found a condition-by-delay interaction; after one week, repeated testing yielded 61% recall versus 40% for repeated study. A follow-up t test quantified that contrast. Interpretive limit: The result concerns the passages, timing, and recall task used in these experiments. |
| Cohen et al. (2006) Values affirmation | Question: Could a brief values-writing exercise affect course grades? Design and sample: Randomized field experiments with seventh graders in two cohorts at one school. Analysis and finding: Regression analyses found higher grades among African American students assigned to the affirmation exercise. Interpretive limit: The result supports the effect of assignment in this setting; it does not guarantee the same effect in every school. |
| Open Science Collaboration (2015) Replication | Question: How did selected published psychology findings fare in direct replication? Design and sample: Coordinated replication of 100 studies from three psychology journals. Analysis and finding: For selected effects, 97% of originals and 36% of replications reported statistical significance; replication effects were smaller on average. Interpretive limit: The figures describe this selected set and one replication criterion, not all psychology. |
| Hyde (2005) Gender differences | Question: How large are psychological gender differences across research areas? Design and sample: Review of 46 meta-analyses covering many psychological outcomes. Analysis and finding: Standardized effect sizes were mostly small or near zero, though some were larger. Interpretive limit: Any synthesis depends on the quality, measures, and populations of its included studies. |
Key terms
Research question; hypothesis; operational definition; population; sample; random sampling; random assignment; independent variable; dependent variable; confound; reliability; validity; case study; grounded theory; mixed methods; factor analysis; correlation; regression; R²; moderator; mediator; experiment; t test; ANOVA; null hypothesis; Type I error; Type II error; p-value; effect size; confidence interval; internal validity; external validity; replication.
Questions for review
- A survey finds that students who study more earn higher exam scores. What can this finding establish, and what additional design would better address a causal question?
- Explain the difference between random sampling and random assignment. Which question does each help answer?
- If a study reports r = .20 between study hours and exam scores, what is R² in a simple linear regression, and how should it be interpreted?
- Why might a p-value below .05 be insufficient for deciding whether a finding matters in practice?
- Give one reason a carefully conducted result might differ when a study is repeated in another setting.
- In Roediger and Karpicke’s experiment, why would reporting only the average difference between learning conditions hide an important result?
- In Wang and colleagues’ survey, what evidence supports the word “moderates,” and what causal claim would go beyond the design?
- How did Soubra and colleagues use the sequence of interviewing and analysis to build a grounded theory? What would their study be unable to estimate for a wider population?
References
Baron, R. M., & Kenny, D. A. (1986). The moderator–mediator variable distinction in social psychological research. Journal of Personality and Social Psychology, 51, 1173–1182. https://doi.org/10.1037/0022-3514.51.6.1173
Cohen, G. L., Garcia, J., Apfel, N., & Master, A. (2006). Reducing the racial achievement gap: A social-psychological intervention. Science, 313, 1307–1310. https://doi.org/10.1126/science.1128317
Duckworth, A. L., Peterson, C., Matthews, M. D., & Kelly, D. R. (2007). Grit: Perseverance and passion for long-term goals. Journal of Personality and Social Psychology, 92, 1087–1101. https://doi.org/10.1037/0022-3514.92.6.1087
Eisenberger, N. I., Lieberman, M. D., & Williams, K. D. (2003). Does rejection hurt? An fMRI study of social exclusion. Science, 302, 290–292. https://doi.org/10.1126/science.1089134
Hyde, J. S. (2005). The gender similarities hypothesis. American Psychologist, 60, 581–592. https://doi.org/10.1037/0003-066X.60.6.581
Morris, M. E., Kuehn, K. S., Brown, J., Nurius, P. S., Zhang, H., Sefidgar, Y. S., Xu, X., Riskin, E. A., Dey, A. K., Consolvo, S., & Mankoff, J. (2021). College from home during COVID-19: A mixed-methods study of heterogeneous experiences. PLOS ONE, 16, e0251580. https://doi.org/10.1371/journal.pone.0251580
National Institute of Standards and Technology. (n.d.). Engineering Statistics Handbook. https://www.itl.nist.gov/div898/handbook/
Open Science Collaboration. (2015). Estimating the reproducibility of psychological science. Science, 349, aac4716. https://doi.org/10.1126/science.aac4716
Roediger, H. L., III, & Karpicke, J. D. (2006). Test-enhanced learning: Taking memory tests improves long-term retention. Psychological Science, 17, 249–255. https://doi.org/10.1111/j.1467-9280.2006.01693.x
Scoville, W. B., & Milner, B. (1957). Loss of recent memory after bilateral hippocampal lesions. Journal of Neurology, Neurosurgery & Psychiatry, 20, 11–21. https://doi.org/10.1136/jnnp.20.1.11
Severe, E., Stalnaker, J., Hubbard, A., Hafen, C. H., & Bailey, E. G. (2024). To participate or not to participate? A qualitative investigation of students’ complex motivations for verbal classroom participation. PLOS ONE, 19, e0297771. https://doi.org/10.1371/journal.pone.0297771
Soubra, K., Tamworth, C., Kamal, Z., Brook, C., Langdon, D., & Billings, J. (2023). Health and social care workers experiences of coping while working in the frontline during the COVID-19 pandemic: One year on. PLOS ONE, 18, e0284306. https://doi.org/10.1371/journal.pone.0284306
Wang, X., Cai, L., Qian, J., & Peng, J. (2014). Social support moderates stress effects on depression. International Journal of Mental Health Systems, 8, 41. https://doi.org/10.1186/1752-4458-8-41
Wasserstein, R. L., & Lazar, N. A. (2016). The ASA statement on p-values: Context, process, and purpose. The American Statistician, 70(2), 129–133. https://doi.org/10.1080/00031305.2016.1154108
American Psychological Association. (2017). Ethical principles of psychologists and code of conduct (2002, amended effective June 1, 2010, and January 1, 2017). https://www.apa.org/ethics/code
U.S. Department of Health and Human Services, Office for Human Research Protections. (n.d.). Human research protection training. https://www.hhs.gov/ohrp/education-and-outreach/online-education/human-research-protection-training/index.html